Seaborn
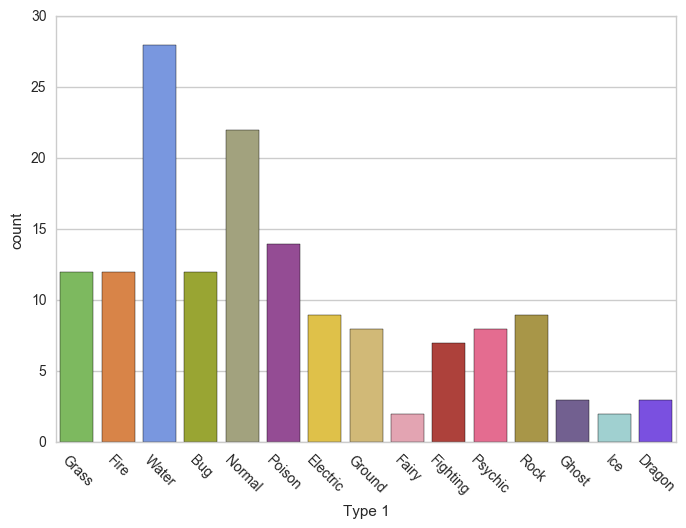
0]Countplot [aama x axix pr name che aene cross ma lkhva tay che]
sns.countplot(x='Type 1',data=df,palette='rainbow')
plt.xticks(rotation=70)
plt.rcParams['xtick.labelsize'] = 15
plt.rcParams['axes.labelsize'] = 20

01]ax=df[1:50].plot.area(alpha=0.4, figsize=(5,4))
ax.legend(bbox_to_anchor=(1.0,1.0))
[aama instant,season,yr,mnth,hr........graph ni bhar lkhva mate
use tay che ax.legenda vadi line add karvi]

1] sns.barplot(x='sex',y='total_bill',data=tips)

Boxplot
2]sns.boxplot(data=df) #pokemon
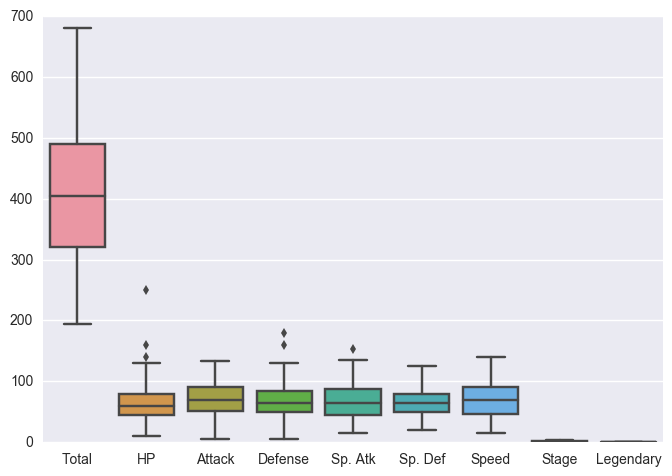
2] # Pre-format DataFrame #pokemon
 2]sns.boxplot(x='day',y='total_bill',data=tips,palette="rainbow") #palette use for color
#class

2]sns.boxplot(data=tips,palette="rainbow",orient='h') #class
#orient ie lkhe ye che ke output y axis pr aave jo orient na lkheye
na lkheye to output x axis pr aave ie totalbil,tip,size ae x axis pr aave

2] sns.boxplot(x='day',y='total_bill',hue='smoker',data=tips,palette="rainbow")
#we use hue for comparisn
#class

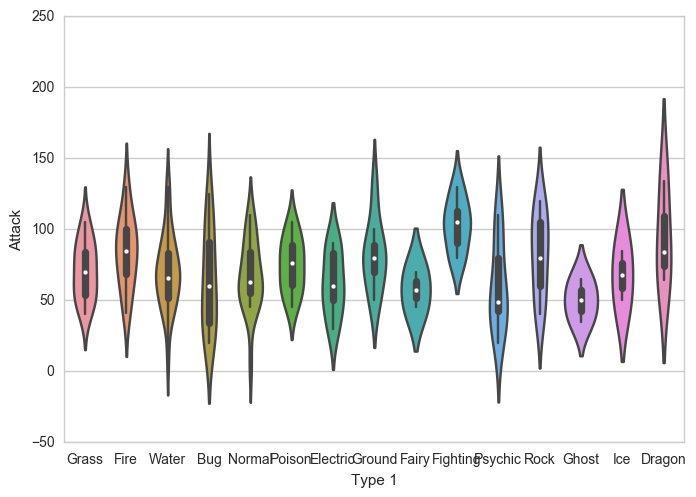
Violinplot
#3c ie class ma krelu
3c]sns.violinplot(x='day',y='total_bill',hue='smoker',data=tips,palette="rainbow")

3c]sns.violinplot(x='day',y='total_bill',hue='sex',data=tips,palette="rainbow")

3]#pokemon detaset
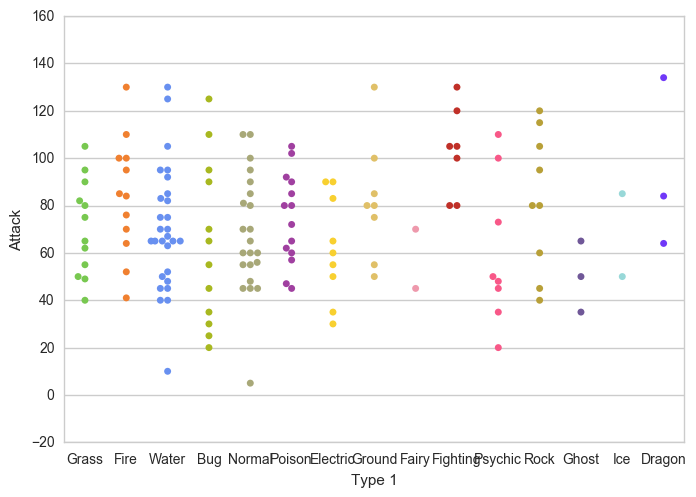
Swarm plot pokemon dataset


# pair Grid


sns.countplot(x='Type 1',data=df,palette='rainbow')
plt.xticks(rotation=70)
plt.rcParams['xtick.labelsize'] = 15
plt.rcParams['axes.labelsize'] = 20
01]ax=df[1:50].plot.area(alpha=0.4, figsize=(5,4))
ax.legend(bbox_to_anchor=(1.0,1.0))
[aama instant,season,yr,mnth,hr........graph ni bhar lkhva mate
use tay che ax.legenda vadi line add karvi]
1] sns.barplot(x='sex',y='total_bill',data=tips)
Boxplot
2]sns.boxplot(data=df) #pokemon
2] # Pre-format DataFrame #pokemon
stats_df = df.drop(['Total', 'Stage', 'Legendary'], axis=1)
# New boxplot using stats_df
sns.boxplot(data=stats_df)
#class
2]sns.boxplot(data=tips,palette="rainbow",orient='h') #class
#orient ie lkhe ye che ke output y axis pr aave jo orient na lkheye
na lkheye to output x axis pr aave ie totalbil,tip,size ae x axis pr aave
2] sns.boxplot(x='day',y='total_bill',hue='smoker',data=tips,palette="rainbow")
#we use hue for comparisn
#class
Violinplot
#3c ie class ma krelu
3c]sns.violinplot(x='day',y='total_bill',hue='smoker',data=tips,palette="rainbow")
3c]sns.violinplot(x='day',y='total_bill',hue='sex',data=tips,palette="rainbow")
3]#pokemon detaset
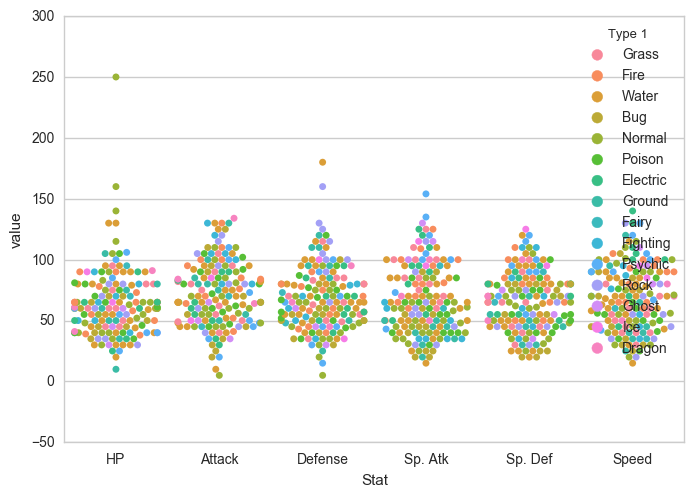
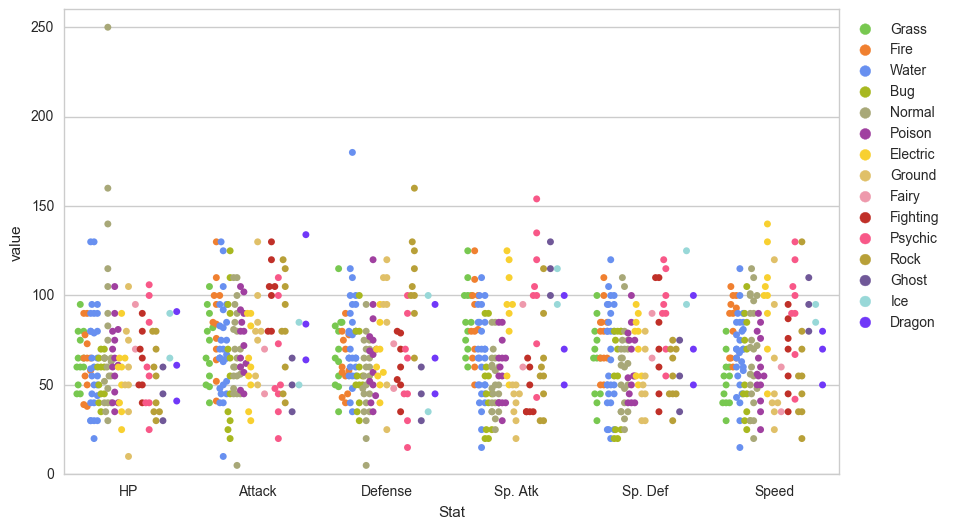
Swarm plot pokemon dataset
4]# Swarm plot with Pokemon color palette
sns.swarmplot(x='Type 1', y='Attack', data=df,
palette=pkmn_type_colors)
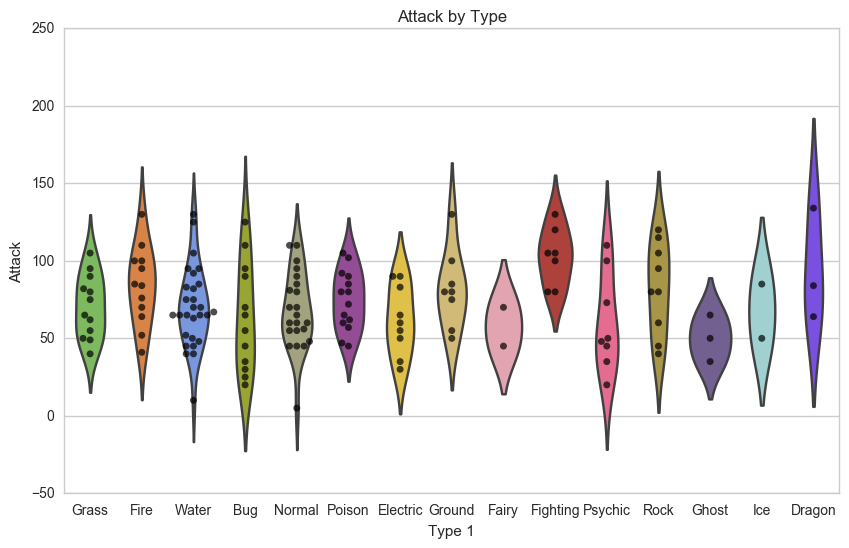
4]# Set figure size with matplotlib
plt.figure(figsize=(10,6))
# Create plot
sns.violinplot(x='Type 1',
y='Attack',
data=df,
inner=None, # Remove the bars inside the violins
palette=pkmn_type_colors)
sns.swarmplot(x='Type 1',
y='Attack',
data=df,
color='k', # Make points black
alpha=0.7) # and slightly transparent
# Set title with matplotlib
plt.title('Attack by Type')
Swarm plot
5]sns.swarmplot(x='Stat', y='value', data=melted_df,
hue='Type 1')
5]
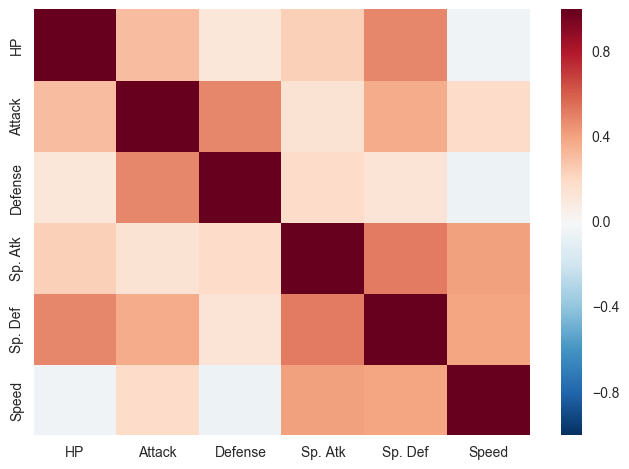
Heatmap
10.1 - Heatmap
Heatmaps help you visualize matrix-like data.
10.2 - Histogram
Histograms allow you to plot the distributions of numeric variables.
10.3 - Bar Plot
Bar plots help you visualize the distributions of categorical variables.
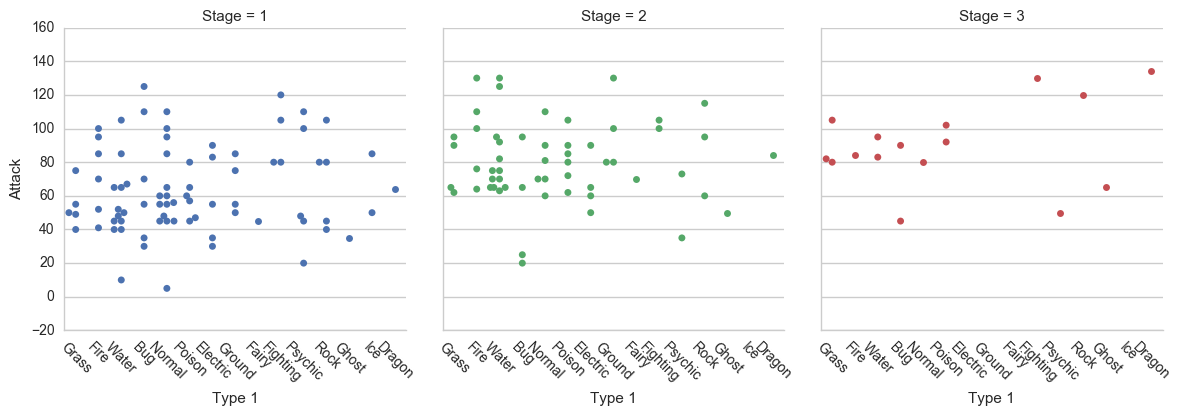
10.4 - Factor Plot
Factor plots make it easy to separate plots by categorical classes.
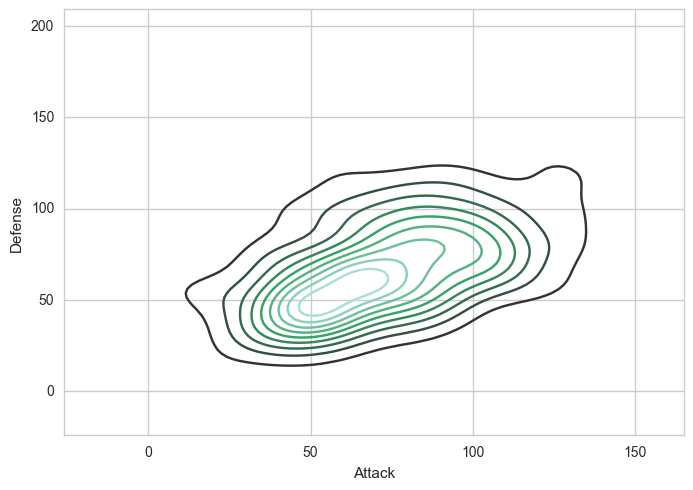
10.5 - Density Plot
Density plots display the distribution between two variables.
- Tip: Consider overlaying this with a scatter plot.
10.6 - Joint Distribution Plot
Joint distribution plots combine information from scatter plots and histograms to give you detailed information for bi-variate distributions.
GRID
6]
import seaborn as sns
import matplotlib.pyplot as plt
%matplotlib inline
iris=sns.load_dataset('iris')
iris.head()
| sepal_length | sepal_width | petal_length | petal_width | species | |
|---|---|---|---|---|---|
| 0 | 5.1 | 3.5 | 1.4 | 0.2 | setosa |
| 1 | 4.9 | 3.0 | 1.4 | 0.2 | setosa |
| 2 | 4.7 | 3.2 | 1.3 | 0.2 | setosa |
| 3 | 4.6 | 3.1 | 1.5 | 0.2 | setosa |
| 4 | 5.0 | 3.6 | 1.4 | 0.2 | setosa |
7]
sns.PairGrid(iris)
g=sns.PairGrid(iris)
g.map(plt.scatter)
The article is so appealing. You should read this article before choosing the Big Data Implementation Services you want to learn.
ReplyDeleteWell written articles like yours renews my faith in today's writers. The article is very informative. Thanks for sharing such beautiful information.
ReplyDeleteBest Data Migration tools
Penetration testing companies USA
What is Data Lake
Artificial Intelligence in Banking
What is Data analytics
Big data Companies USA